
This post title is an admittedly thinly-veiled reference to Netflix’s hit series, Stranger Things. If you’ve never seen the show (or even heard of it), rest assured we won’t spoil anything with our research. However, we will tell you that the appeal of Stranger Things is due largely to a heavy dose of nostalgia that reminds of us of a simpler time when we could actually indulge our woolgathering. But there’s no time for absentminded daydreaming, so let’s get down to business… looking at things upside down; that is, inverted.
First, let’s look at the recent manufacturing index numbers from the Institute of Supply Management. You may see this index referred to as the ISM Purchasing Manager’s Index, and it’s a good (yet imperfect and incomplete) guide to the business cycle. If we look at the prices that manufacturers paid (used as a gauge of inflation at the beginning of the manufacturing process) and invert it against the manufacturing index, perhaps we can perform a little ad-hoc forecasting on the business cycle. Our logic is that higher prices paid will be a drag on growing business activity at some point in the future.
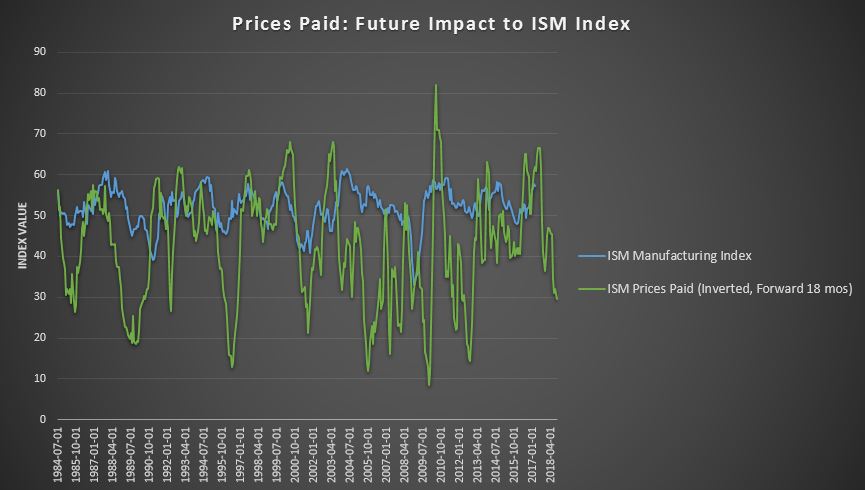
(Source: ISM via Quandl, Targeted Wealth Solutions)
Eyeballing the chart, there appears to be some delay in when manufacturers experience rising prices and when manufacturing activity declines. We’ve inverted (and there’s your connection to the “Upside Down”) and advanced the Prices Paid series 18 months into the future, and there seems to be a decent visual fit between the two series. Alongside a simple 3-month moving average of the Chicago Fed National Activity Index, which shows U.S. economic activity “above trend,” immediate concerns for a swift downturn based on rising inflationary pressures appear to be misplaced. But has above trend growth peaked?
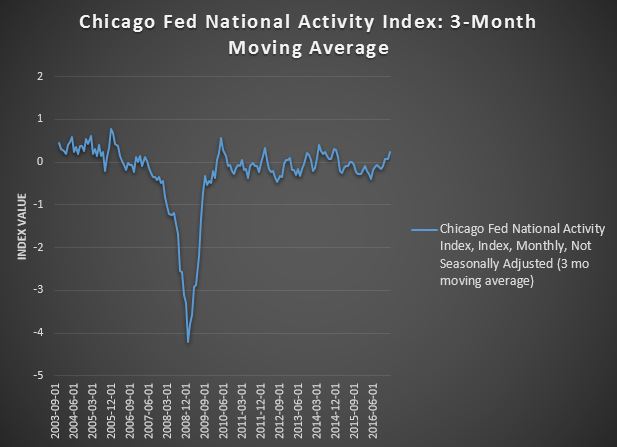
(Source: Chicago Fed, Targeted Wealth Solutions)
So what about the recent calm in the stock market? The measure of “fear” in the S&P 500 — the CBOE’s Volatility Index (or VIX) — has been muted for quite some time, and it raises a question about why investors aren’t nervous about future volatility. A higher VIX is usually associated with market drawdowns, corrections, or uncertainty, so a lower VIX is normally associated with the status quo or a bullish trend. There’s more nuance to the VIX, but we’ll leave it at that (and we remember our promise to talk about implied volatility in a future post). So let’s use the “upside down” again to see if we can draw any conclusions from business cycle outlook and “fear” in the market:
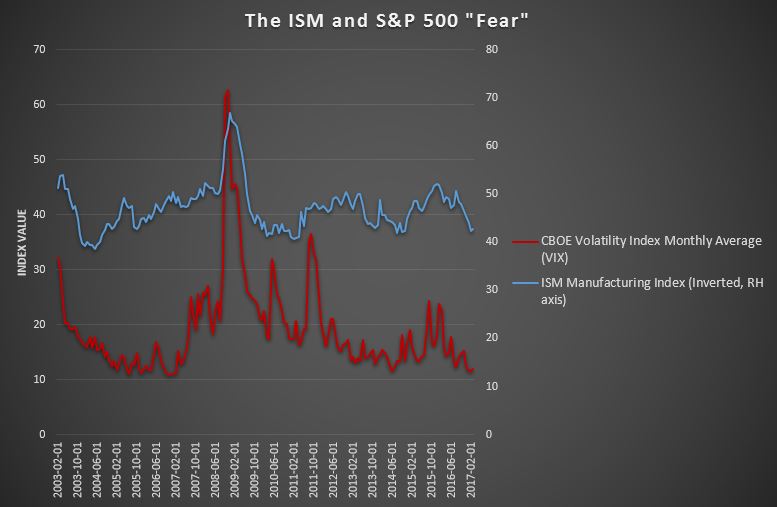
(Source: St. Louis Fed, ISM via Quandl, Targeted Wealth Solutions)
Inverting the ISM index paints a pretty nice picture of investor calm (complacency?) as indicated by the level of the VIX.
Consumers are feeling pretty good — another win for the soft data. Will soft data translate into real activity? We posed that question in our last post and the jury is still out.
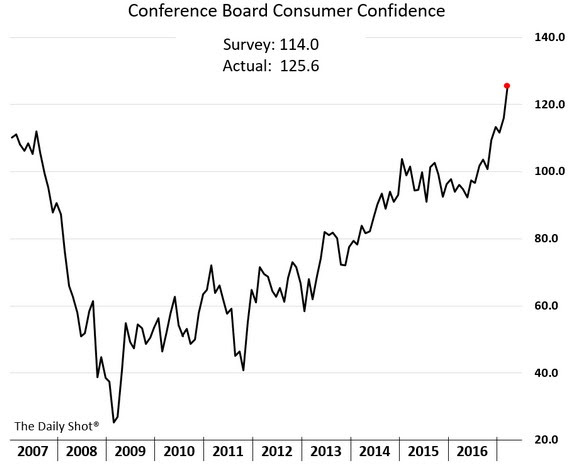
(Source: The Daily Shot)
We also talked about investors discounting the likelihood of tax reform this year, and it appears that market action has confirmed that. Companies that stood to benefit the most from significant tax reform (the high tax rate companies) performed well after the election, but have since surrendered those gains as reform looks further down the road:
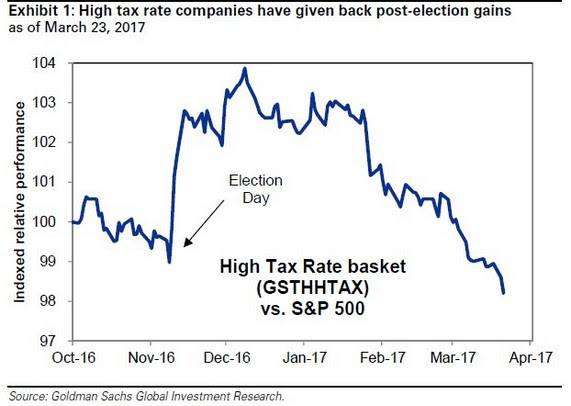
(Source: The Daily Shot)
The spread between soft and hard data continues to widen. This week’s release of economic data could provide some helpful clues whether optimism is fueling actual economic output. Regardless of the outcome — crashing confidence or soaring output — we ensure that our clients are invested according to their quantified risk tolerance… removing the noise and emotion from investing is a large part of the value that we bring as advisors.
—
Mention of products, providers, or services does not constitute an endorsement, recommendation, or relationship.
The information presented here is for informational purposes only, and this document is not to be construed as an offer to sell, or the solicitation of an offer to buy, securities. Some investments are not suitable for all investors, and there can be no assurance that any investment strategy will be successful. The hyperlinks included in this message provide direct access to other Internet resources, including Web sites. While we believe this information to be from reliable sources, Targeted Wealth Solutions LLC is not responsible for the accuracy or content of information contained in these sites. Although we make every effort to ensure these links are accurate, up to date and relevant, we cannot take responsibility for pages maintained by external providers. The views expressed by these external providers on their own Web pages or on external sites they link to are not necessarily those of Targeted Wealth Solutions LLC.