While we won’t win any literary contests with our Brexit + Regret mashup, we felt it was an appropriate title given the market’s reaction to the UK referendum to leave the European Union. If anything, market myopia seems to be rapidly switching risk sentiment based on the “nearest, hottest threat.” Despite the lingering uncertainty over what a post-Brexit EU will look like and the impact to continental and periphery economies, the focus soon switched to the US employment situation, currency volatility, elections in Japan (and the subsequent stimulus plans), macroeconomic data from China, the failed coup in Turkey, and whatever seemed to dominate the 24-hour financial news cycle. The past month has certainly been a cautionary tale of drowning in the noise of global markets — and a reminder to stay the course based on your risk tolerance and financial objectives.
Since Brexit, US markets have showed renewed signs of energy and some of the economic indicators we were watching back in February (see our post “Signs of Life?“) have turned the corner. In fact, investor sentiment has moved into the Bullish camp as of last week:
(Source: Investors Intelligence via Yardeni Research)
Part of the story involves the Goldilocks growth here in the US: not too hot; not too cold. While on the cold side, the data continue to suggest the Fed won’t change its accomodative policy, which has shown up in the futures market’s probability of rates remaining unchanged at the Fed’s next meeting:
(Source: CME Group)
Although the June Nonfarm Payrolls beat expectations, the revision to May was pretty dismal (May’s 11,000 looks pretty sad next to those other numbers…):
(Source: Trading Economics)
However, the Economic Cycle Research Institute’s Weekly Leading Index continues to show multi-year strength. The index, although somewhat volatile, is comprised of a proprietary mix of economic indicators that have shown to lead economic turning points and recessions.
(Source: ECRI)
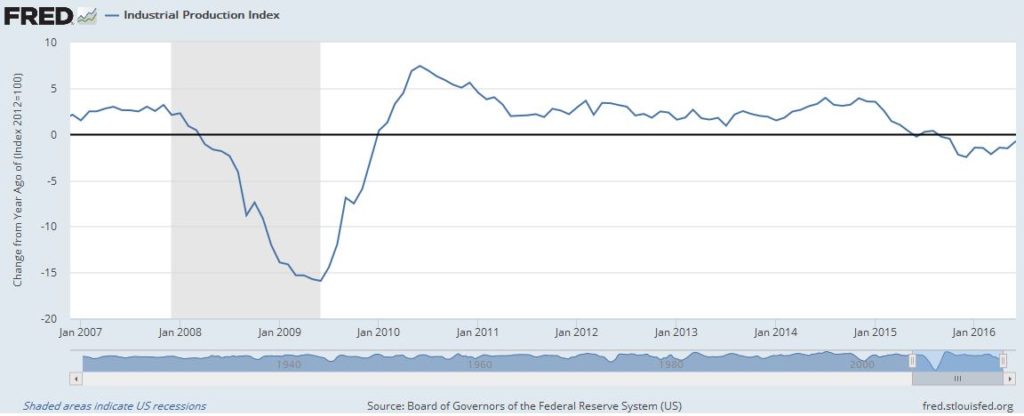
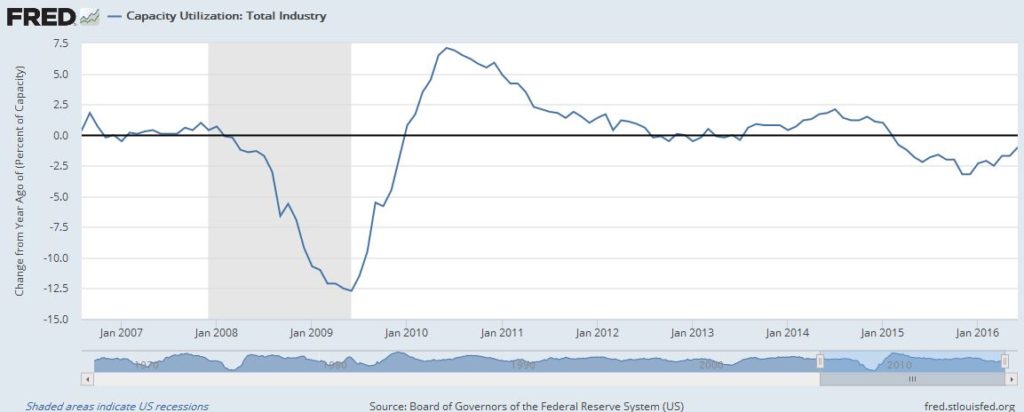
And the data we mentioned back in February that would give us reason to re-think the recession call — Industrial Production and Capacity Utilization — have appeared to be recovering off a recent weakness on a “change from a year ago” basis:
(Source: St. Louis Fed)
However, crude stocks remained elevated as the Baker Hughes rig count began to turn up again. There tends to be a 3-4 month lag between crude prices and rig counts, so this recent upward trend in the rig count isn’t too terribly surprising. After peaking around $51 per barrel, light sweet crude is now hovering in the $45-$47 range.
(Sources: EIA and Investing.com)
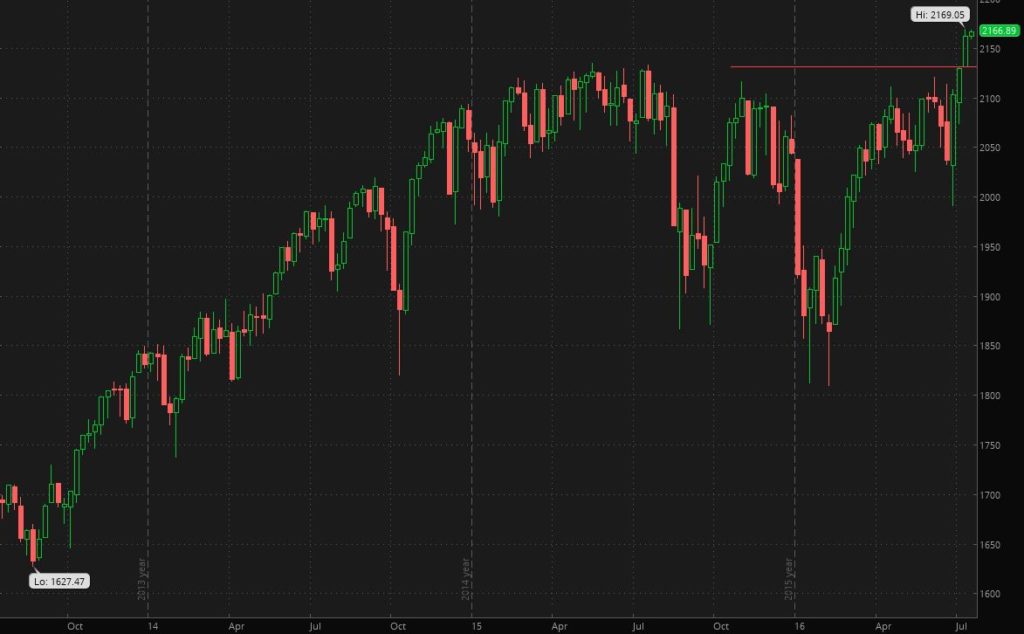
The news of the S&P 500 breaking out to new all-time highs was the centerpiece of most financial news last week — either in the context of “buy into strength” or “sell the highs.” Market participation and breadth indicators seem to support the former notion, although valuations may be stretched… unless you look at Price-to-Earnings relative to bonds. That’s a debate for a different briefing room post, so we’ll just put an image of the S&P 500 breaking out on a weekly chart:
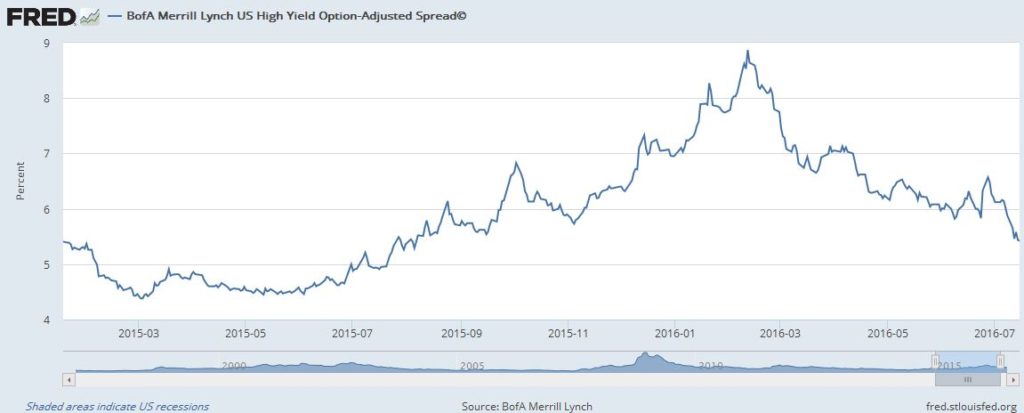
With high yield bond spreads continuing their downtrend (and bond prices going up), investor risk appetite continues to grow as the demand for junk debt increases:
(Source: St. Louis Fed)
With US GDP forecasts inching up marginally, the outlook for the second half looks a little brighter. Consumer spending is holding up, although Brexit did have a dulling effect on sentiment. Once again, we find ourselves lamenting muted growth and economic data while justifying higher equity prices with an accomodative rate environment. If the growth engine heats up (specifically PCE, the Fed’s preferred measure of inflation), then we suspect good news will be bad news again as the threat of a rate hike comes back into play. We’re focused on providing relief from the noise of financial markets, which means ensuring our clients understand their risk tolerance, investment timelines, and financial objectives — and then ensuring portfolios are built to satisfy those constraints.
—
The information presented here is for informational purposes only, and this document is not to be construed as an offer to sell, or the solicitation of an offer to buy, securities. Some investments are not suitable for all investors, and there can be no assurance that any investment strategy will be successful. The hyperlinks included in this message provide direct access to other Internet resources, including Web sites. While we believe this information to be from reliable sources, Targeted Wealth Solutions LLC is not responsible for the accuracy or content of information contained in these sites. Although we make every effort to ensure these links are accurate, up to date and relevant, we cannot take responsibility for pages maintained by external providers. The views expressed by these external providers on their own Web pages or on external sites they link to are not necessarily those of Targeted Wealth Solutions LLC.


