
If you’ve read any of our posts, you know that we tend to avoid certainties — especially when variables can be vastly different depending on the context of the situation. One man’s trash is another man’s treasure, as the saying goes… well, perhaps that’s poor cliche choice, but the point is that competing objectives and resource scarcity may require solutions that are otherwise dismissed as ineffective in more common situations. So if you want to skip right to the punch line, the answer to the 60/40 portfolio question is… “it depends.”
Before you throw your hands up in exasperation and close your internet browser, let us explain.
First and foremost, we have to define the 60/40 portfolio — it could be a number of variations of an exposure to 60% stocks and 40% bonds. You could chop up your equity exposure among U.S. and international stocks, or elect to exclude corporate bonds from your debt exposure. There are many ways to slice that pie, so to speak. To keep things simple, however, we’ll look at three popular 60/40 funds: the Vanguard Balanced Index Fund, the DFA Global Allocation 60/40 Fund, and the do-it-yourself 60% SPDR S&P 500 ETF (SPY) and 40% iShares Barclays Aggregate Bond Fund (AGG).
The Vanguard fund has an almost exclusive U.S. home bias; that is, it seeks to track an exposure to the CRSP U.S. Total Market Index for stocks and the Bloomberg Barclays U.S. Aggregate Float Adjusted Bond Index. The bond index does have exposure to some dollar-denominated foreign bonds, but as of October 1st those holdings account for about 2% of the total fund. (source: Vanguard)
Unsurprisingly, the DFA Global fund is allocated across global markets: about 40% U.S. stocks, 1.5% U.S. real estate, 14% international developed stocks, 4% emerging markets stocks, and 40% of a smattering of hedged, unhedged, global, domestic, inflation-protected, and extended quality (below investment grade) bonds. (source: Dimensional Fund Advisors)
Let’s ignore costs right now (something that we normally don’t say) and look at historical performance. We’ll rebalance the do-it-yourself portfolio on an annual basis.
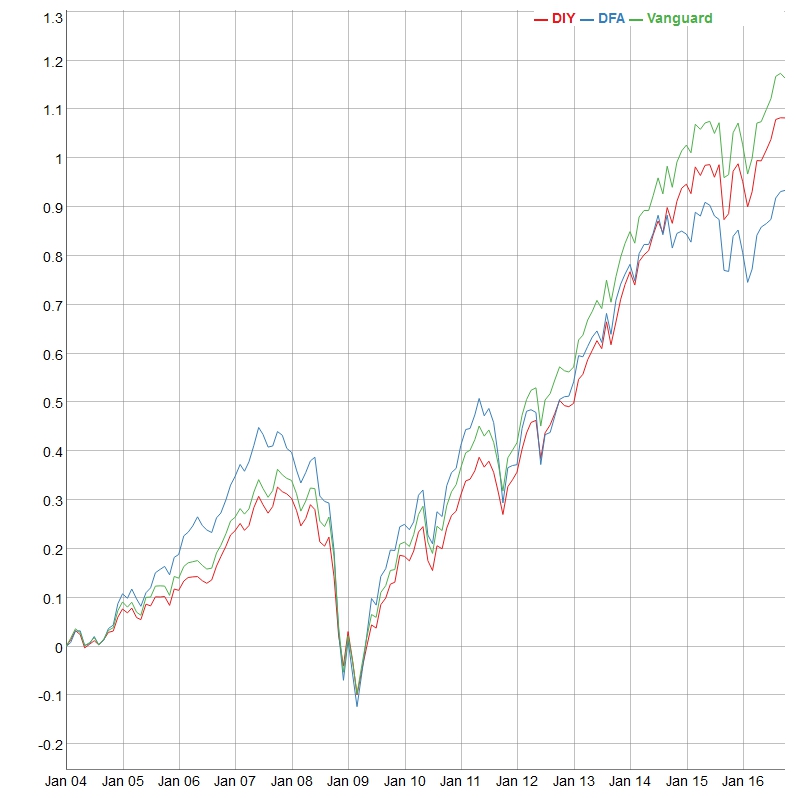
(Source: Data from Yahoo! Finance; chart/calculations from author)
As you can see, having an exposure to the U.S. broad equity market captured more upside than the DIY (do-it-yourself) sole exposure to the S&P 500. Both portfolios’ bond exposures were academically equal, since AGG and the Vanguard fund track the same index. The DFA portfolio, with its allocation to global markets, suffered from lagging performance compared to a portfolio exclusively focused on U.S. markets.
From a risk metric standpoint, here’s a table of pertinent data (with the exception of the Sharpe ratios, these are percentages):
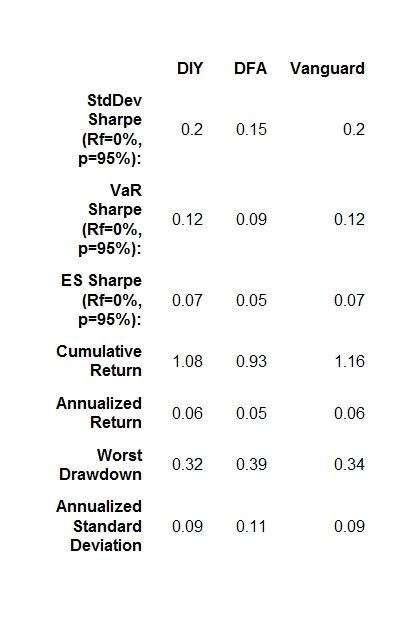
(Source: Data from Yahoo! Finance; table/calculations from author)
So even through the rough 2008-2009 years, the 60/40 portfolio is returning about 6% on an annualized gross, nominal basis (not adjusted for fees or inflation). The drawdowns of 32-39% are certainly better than the 53% drawdown of the S&P 500 during the same period, and the standard deviation (volatility) is less.
Notwithstanding the incredibly bad impact to pre-retirement (and retirement) savers as the financial crisis hit, one could argue that the 60/40 did its job mitigating losses and providing enough return on an annualized basis to justify its continued existence.
But that’s just looking in the rearview mirror and at a very thin slice of the characteristics of the portfolio. What if we looked at some second-order effects; namely, the diversification benefits over time? What if we cobbled together a rough return forecast for both stocks and bonds in this new “lower for longer” environment? After all, part of the appeal of the 60/40 is that it will continue to protect on the downside and offer enough upside to make it attractive on a risk-adjusted basis.
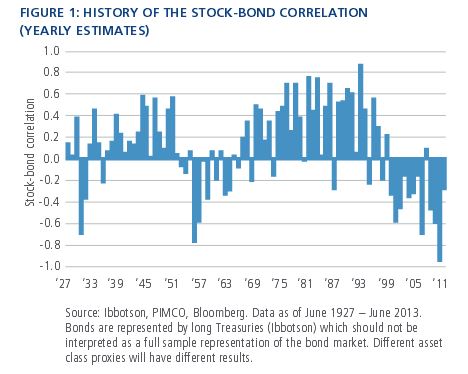
PIMCO ran a white paper in 2013 that looked at the historical correlation between stocks and bonds. Their findings (here) supported the hypothesis that interest rates and inflation played a crucial role in the relationship between stocks and bonds; that is, purely looking at correlation out of economic context could lead to incomplete conclusions:
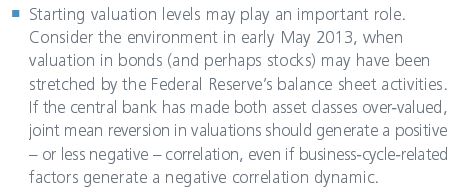
I really liked PIMCO’s summary bullet point, which calls into question the short-run diversification benefits of a 60/40 portfolio at this present point in history:
Like we mentioned in our previous post, cross-asset sensitivity to a common market factor has recently led to assets acting more harmoniously than expected… especially to the downside. We attributed this central bank activities as well.
When we shift gears to forecasting returns, we have to admit that there’s no crystal ball available on Amazon yet. With that said, we take forecasts with grains of salt, but we will point out that most forecasts paint a picture of prolonged suppressed returns relative to our historical expectations. We’ve included Schwab’s assessment for your consideration:
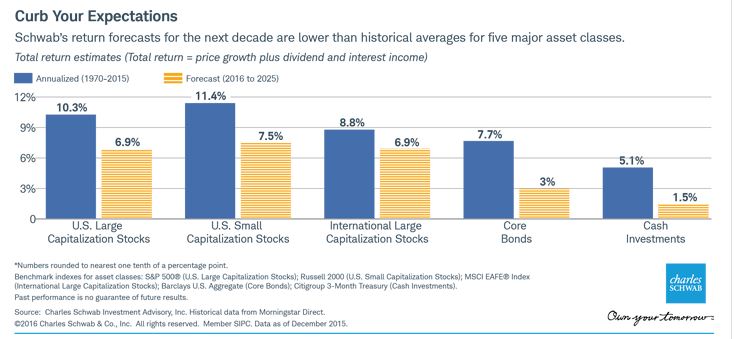
(Source: Charles Schwab)
So let’s just use Schwab’s forecast for U.S. Large Cap Stocks and Core Bonds and see what the future expected nominal return on a 60/40 portfolio is:
(6.9 x 60%) + (3.0 x 40%) = 5.34%
Assuming the same volatility in our 60/40 portfolio, our Sharpe Ratio is going to look worse than in our historical example above. We’ve left out the effects of inflation, so that needs to be taken into account at some point. However, the pertinent points still remain:
- The diversification benefits of the 60/40 may be minimized over the short-run due to stretched valuations of both stocks and bonds
- Stock and bond total returns will probably be lower in the future than we’ve enjoyed over the past 3 decades
If we subscribe to these points, then investors must re-visit the drawing board to determine the risk they’re willing to bear, their objectives, and time horizons. Looking to the past in order to justify the relevance of the 60/40 portfolio may be harmful to your investing health. While not dead, the 60/40 portfolio suffers from ailing arguments that previously bolstered its appeal. We believe that adding exposure to alternative strategies or more tactical tilts (factor-driven) within the portfolio may make sense from a risk-return perspective. While we’re not ready to pull the plug on the 60/40, we admit that it could probably use a check-up.
—
Mention of products, providers, or services does not constitute an endorsement or relationship.
The information presented here is for informational purposes only, and this document is not to be construed as an offer to sell, or the solicitation of an offer to buy, securities. Some investments are not suitable for all investors, and there can be no assurance that any investment strategy will be successful. The hyperlinks included in this message provide direct access to other Internet resources, including Web sites. While we believe this information to be from reliable sources, Targeted Wealth Solutions LLC is not responsible for the accuracy or content of information contained in these sites. Although we make every effort to ensure these links are accurate, up to date and relevant, we cannot take responsibility for pages maintained by external providers. The views expressed by these external providers on their own Web pages or on external sites they link to are not necessarily those of Targeted Wealth Solutions LLC.