
Ah, the payrolls report. It seems like every report is the most important report as we continue in the environment of rate normalization. Given the abundance of steady-as-she-goes economic data, benign stock market activity, and rhetoric moonwalking by the Trump administration, it’s probably a reasonable argument to suggest that the employment report was the last bit of uncertainty before a “guaranteed” March rate hike.
The ADP report (which is released before the Bureau of Labor Statistic’s official report) indicated job growth that beat all estimates… by 110,000 over economists’ forecasts:

(Source: ADP Employment Report)
The “official” release showed similarly impressive February growth at 235,000 with the unemployment rate little changed at 4.7%.
The 66,000 construction number stuck out to us, and given a warm February we wouldn’t be surprised if seasonal hiring was accelerated to take advantage of the mild temperatures. If that’s the case, we would expect to see a softer number at the next report… but as of now the Fed doesn’t have a lot of room to argue against a rate hike at the March meeting this week. The markets have already priced this in from a 30-day Fed Fund futures perspective, so the risk is for Chair Yellen to disappoint the broad consensus.
Speaking of benign markets, we like to keep a close eye on historical (or realized) volatility and implied volatility (what the derivatives markets “think” the volatility is going to be in the future). We’ll save discussions about implied volatility for future posts.
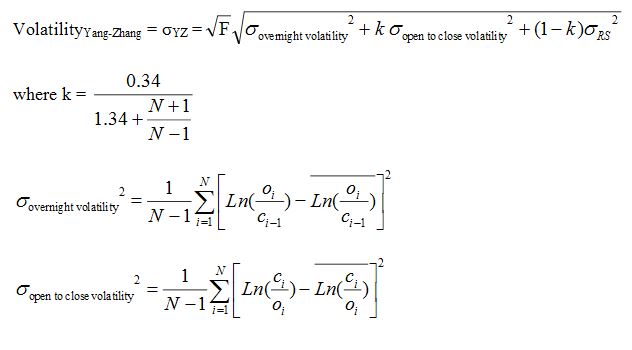
Here we have a the 60-day simple moving average of the price level of the S&P 500 plotted against the 60-day realized volatility of the index. A way to think about realized volatility is the range of price action that happens in the market. Wild swings create higher volatility and muted price movements create lower volatility over a certain time period. High volatility is often associated with downturns in the market. We use the Yang-Zhang method to estimate historical volatility (see formula after our chart).
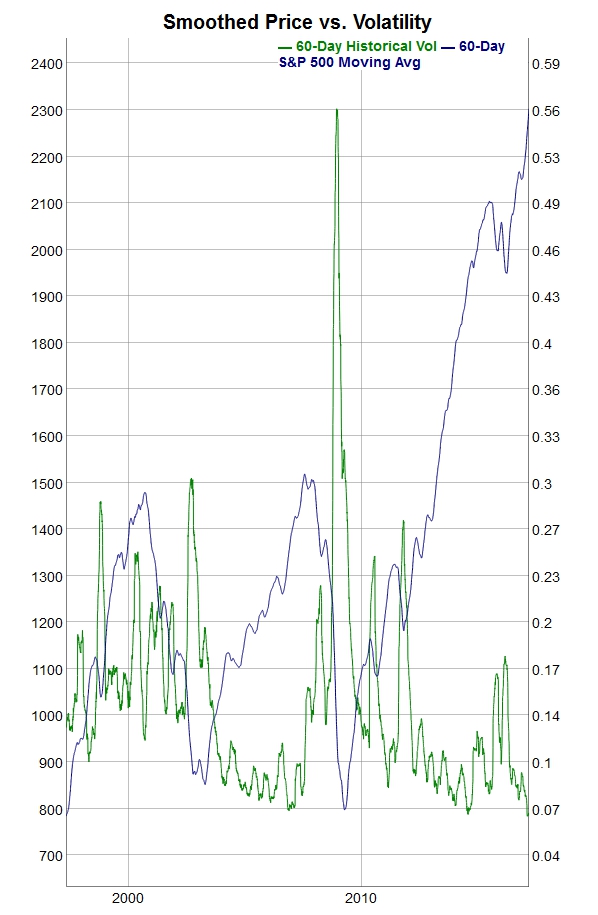
(Source: Targeted Wealth Solutions internal research)
We’ve used 60-day measurements to smooth some of the noise, and a couple of things emerge:
- We’re in a period of historically low realized volatility. The S&P 500 hasn’t “gyrated” a lot lately.
- The “volatility” of the volatility tends to increase as we get closer to inflection or change points in the S&P time series. That is, small shocks mount up over time (and the spikes grow larger) as the price turns lower. This isn’t a hard rule, though: the August 2011 downgrading of U.S. creditworthiness caused an immediate spike in volatility and a sharp move lower in the S&P over the next month, but eventually things calmed down and the bull market resumed.
- Volatility has an autocorrelation or clustering feature and mean reversion. Which is a fancy way of saying that low volatility leads to low volatility and high volatility leads to high volatility… and then everything decays back to the average.
So taken by itself, the information isn’t that actionable. You could argue that this low volatility will revert back to its mean (at a higher level) and we would see a coincident sell-off in the market. Playing the long volatility game has been a fool’s errand as of late, however. Furthermore, the long-term trend remains intact alongside “good enough” macroeconomic data… even if policy uncertainty continues to grow:
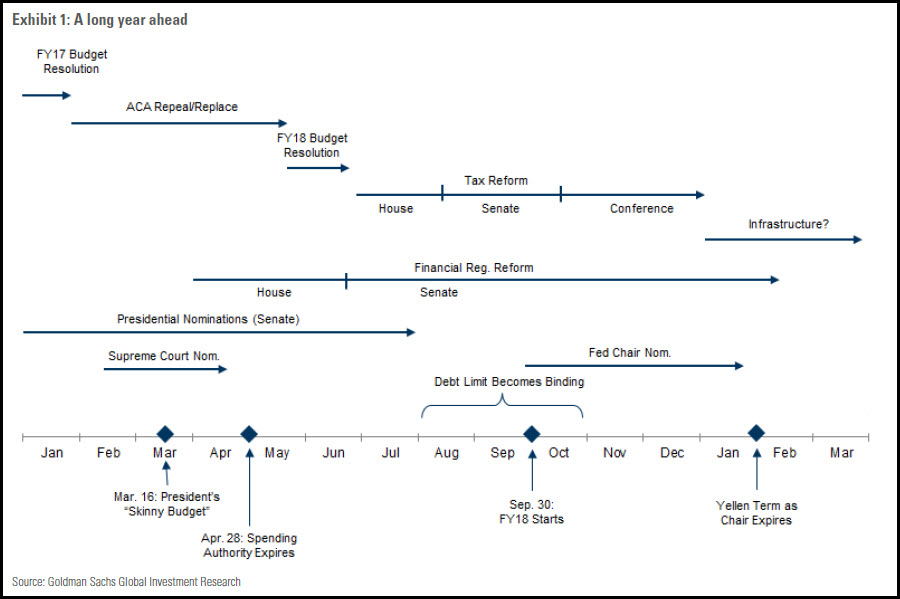
(Source: Goldman Sachs GIR)
As the ACA repeal looks less like a “gimme” and more like a long road ahead, we imagine that Mr. Trump’s other policy efforts will continue to push to the right. With great expectations already priced into certain sectors of the market, we’re not sure how patient investors will be with an extended timeline. There’s also the possibility that reforms and projects won’t be as grand as once thought…
The U.S. consumer showed some reluctance to spend on an inflation-adjusted basis. The Commerce Department said this was the biggest decline since 2009:

(Source: St. Louis Fed)
Real earnings (what employees make after the impact of inflation) dropped in January, so we’ll see what the February numbers look like this week:
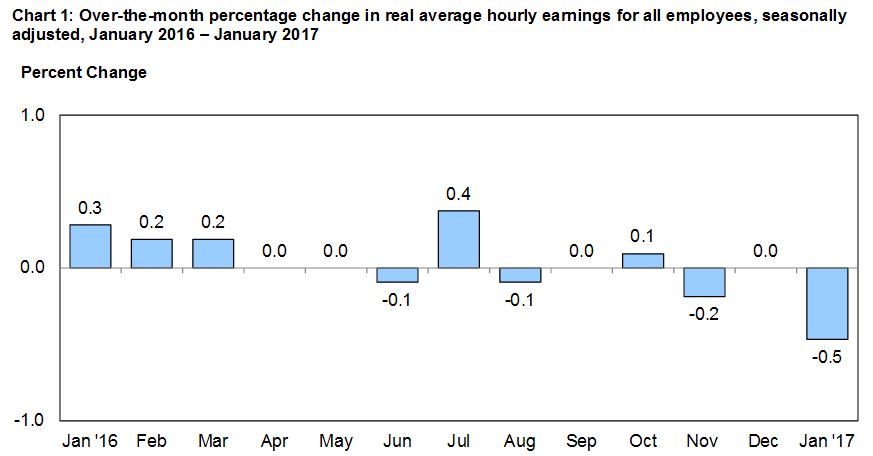
(Source: Bureau of Labor Statistics)
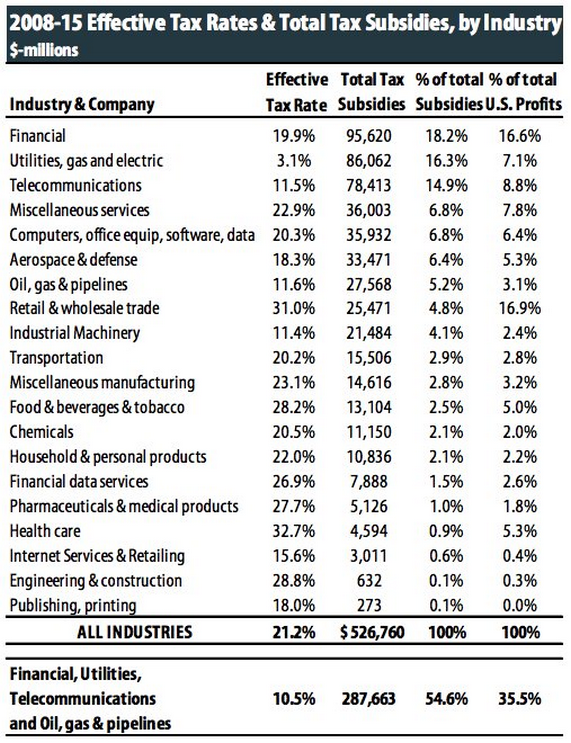
Finally, we leave you with some follow-up information from our previous post on tax reform… which questions the efficacy of a reduction in the corporate tax rate given that effective tax rates are pretty low in some industries. Thanks to the Daily Shot for this data:
—
Mention of products, providers, or services does not constitute an endorsement, recommendation, or relationship.
The information presented here is for informational purposes only, and this document is not to be construed as an offer to sell, or the solicitation of an offer to buy, securities. Some investments are not suitable for all investors, and there can be no assurance that any investment strategy will be successful. The hyperlinks included in this message provide direct access to other Internet resources, including Web sites. While we believe this information to be from reliable sources, Targeted Wealth Solutions LLC is not responsible for the accuracy or content of information contained in these sites. Although we make every effort to ensure these links are accurate, up to date and relevant, we cannot take responsibility for pages maintained by external providers. The views expressed by these external providers on their own Web pages or on external sites they link to are not necessarily those of Targeted Wealth Solutions LLC.